
Transparent City
Get to know your City
The Transparent City dashboards allow users to explore Tax Increment Financing (TIF) districts, City employee data, and other City services. The socioeconomic dashboard can be used to compare U.S. Census demographic data and City government operations.
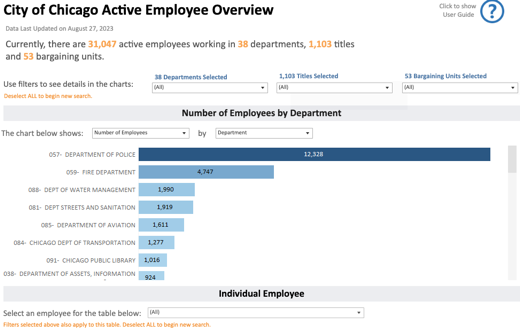
City of Chicago Active Employees: Overview
Find active City employees by title, department, and bargaining unit
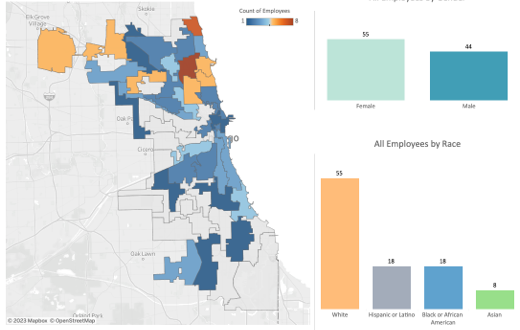
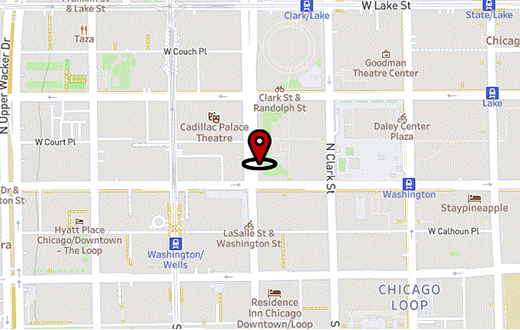
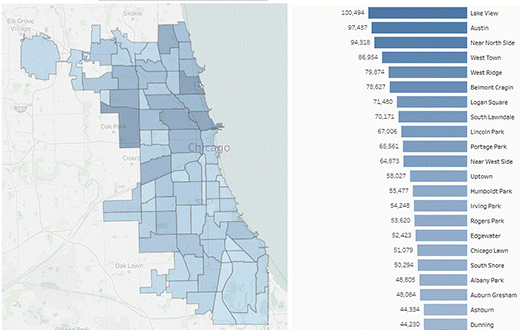
Socioeconomic and City Data Comparison Dashboard
Compare and visualize socioeconomic data by Ward or Community Area
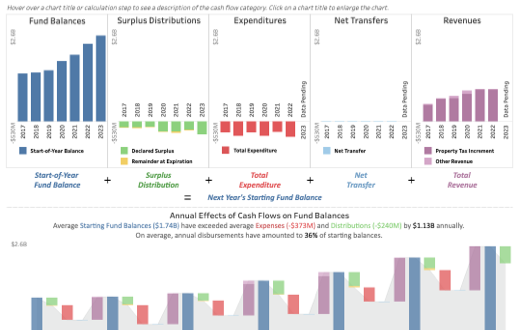
Chicago TIF Districts: Cash Flows
Explore the fund balances, surplus, and expenditures for TIF districts by year
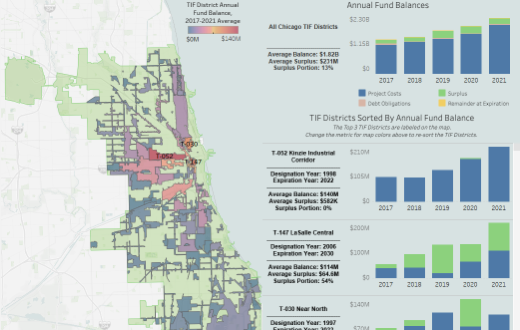
Chicago TIF Districts: Map and Fund Balances
Explore this interactive map showing TIF districts by annual Fund Balances